Business Tips
Fake News Statistics - How Big is the Problem?
Is Fake News a Problem: Statistics Show the Truth. JournoLink takes a deep dive into the latest fake news statistics and trends.

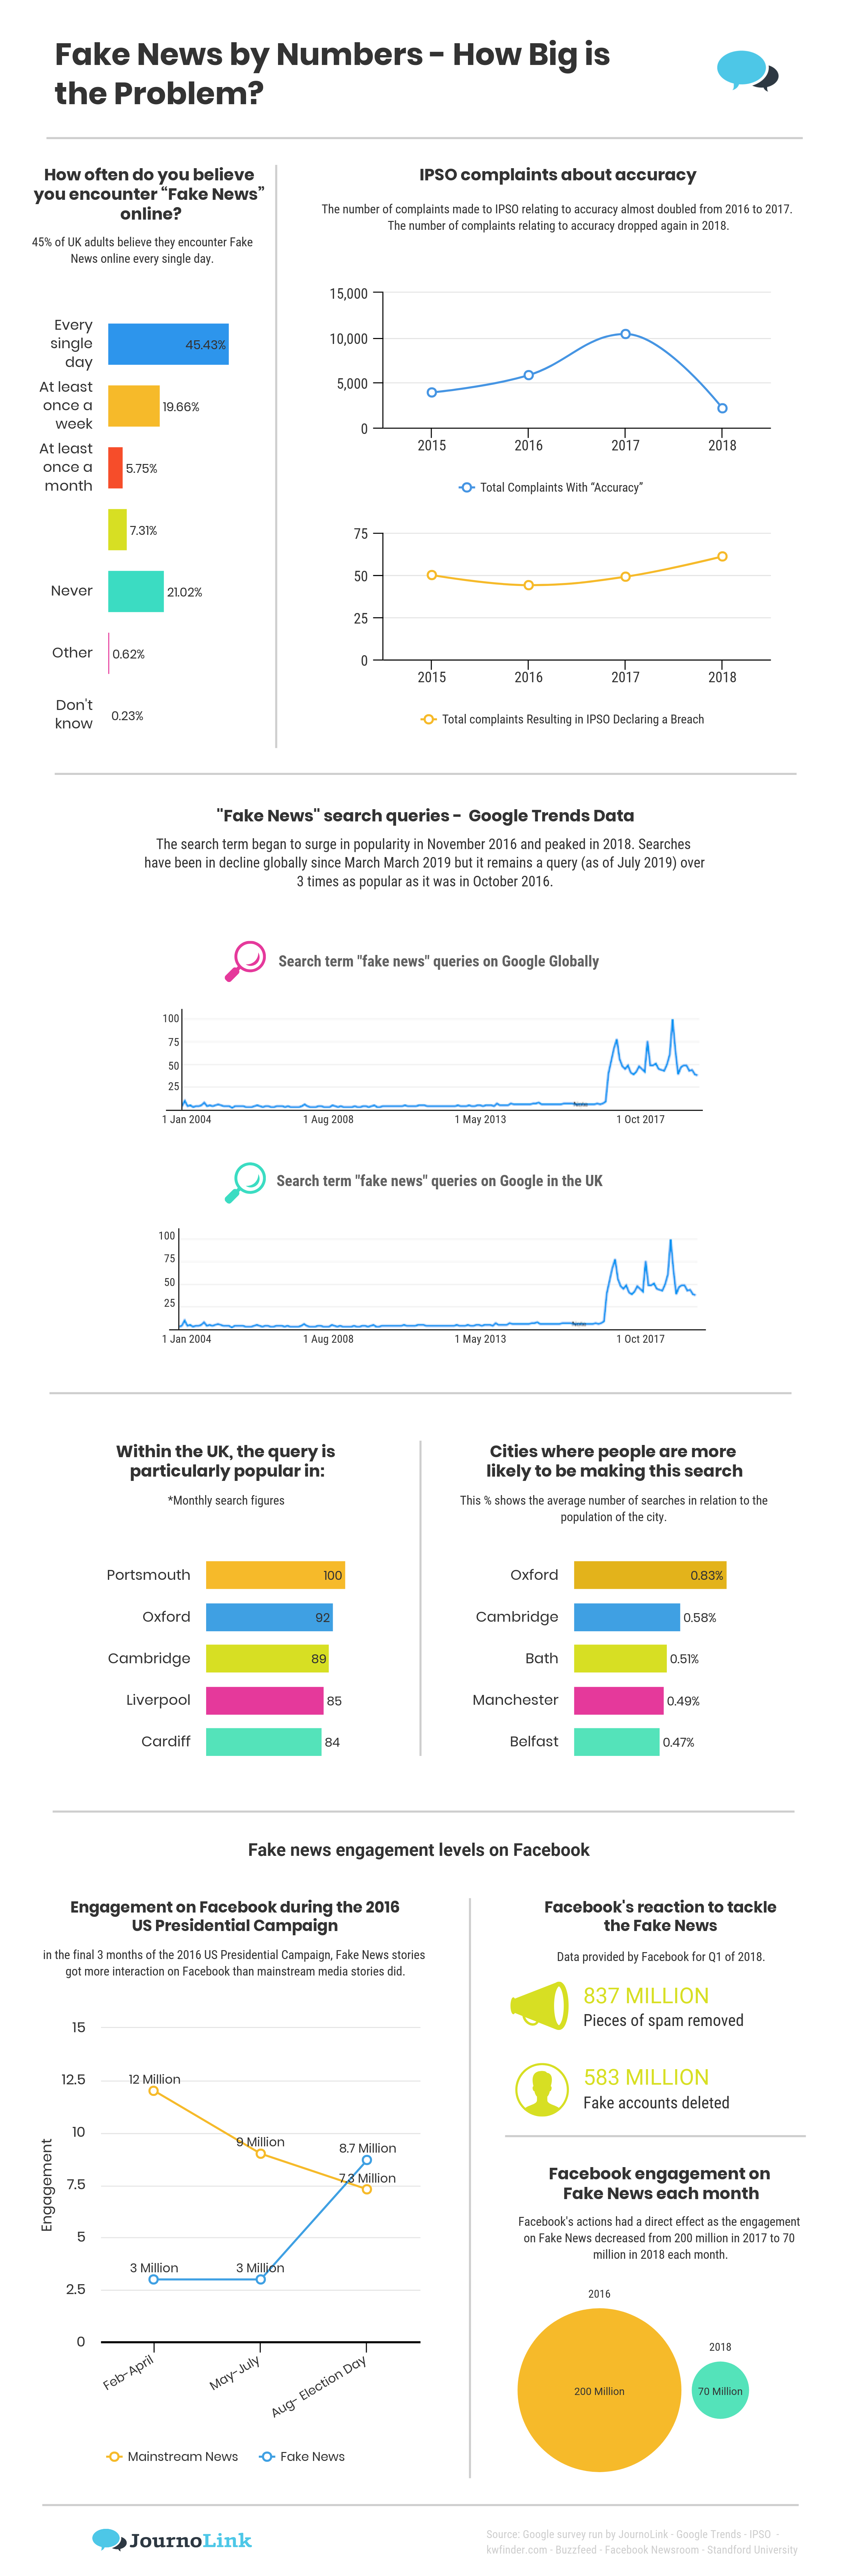
A recent survey found that 45% of adults in the UK believe that they come across fake news every single day….
This seems like a lot, but is it accurate, and what does it mean?
Fake news has been reported in the mainstream media a lot right now, and really took off the 2016 US elections, but what does it even mean and how big a deal is it? Journolink is going to examine fake news statistics; its impact on real news and what measures we can take to ensure the news we read is accurate.
Click here to see the infographic.
What exactly is “Fake News?”
Fake news is misleading information deliberately spread as “news” typically online. There’s an important difference between fake news and simply inaccurate reporting. Fake news implies that the misinformation is absolutely deliberate, whereas small reporting mistakes in the media are generally mistakes that are subsequently corrected by journalists or the media outlet later.
Fake News Statistics
So just how big a deal is it? Let’s take a look at some fake news statistics.
We ran a survey of 1,000 people in the UK to find out how often they felt that they came across fake news online.
In addition, we researched Google Trends and search data to find out how popular a topic is across the globe and analysed other data sources too.
Our key findings in summary:
- 45% of the British public believe they encounter fake news online every single day (data from our own Google Survey run in the past two years)
- From 2015 to 2018, there was a 22% increase in IPSO rulings resulting in a declaration of a breach relating to the accuracy
- At its peak, there were around 200 million monthly engagements with fake news stories on Facebook. These fake news stories are believed to have influenced election results, and even spread misinformation during armed attacks, such as Russia’s invasion of Ukraine or the attack on the US Capitol Building.
Click here to see the infographic.
Public Perception of Fake News
When we sent out our Google Surveys, we only the following question.
“How often do you believe you encounter “fake news” online?”
Here’s how they responded.

- 45.43% believe they encounter fake news online on a daily basis
- A further 19.64% believe they encounter fake news online at least once a week
- Just a fifth believe they never encounter fake news
IPSO Complaints About Accuracy
Key findings from latest published data by the IPSO:
- The number of complaints made to IPSO relating to accuracy almost doubled from 2016 to 2017 from 5,836 to 10,405
- The number of complaints relating to accuracy dropped again in 2018 to 2,150
- The number of complaints resulting in a breach being ruled peaked at 61 in 2018
IPSO publishes complaints made to it about newspapers and magazines it regulates. While inaccurate news isn’t always the same as fake news and isn’t generally deliberate, we assessed whether IPSO is identifying more breaches.
Here’s what we found:
|
Period |
Total Complaints Where “Accuracy” was a Part of the Complaint |
Total Number of Complaints Concerning Accuracy Resulting in IPSO Declaring a Breach |
Number of Complaints Concerning Accuracy Resulting in IPSO No Breach |
|
Jan to Dec 2015 |
3,915 |
50 |
161 |
|
Jan to Dec 2016 |
5,836 |
44 |
119 |
|
Jan to Dec 2017 |
10,405* |
49 |
142 |
|
Jan to Dec 2018 |
2,150 |
61 |
92 |
*Spike in complaints but over 6,000 of these complaints were rejected.
Other outcomes are possible (hence breach, no breach and breach do not add up to the total complaints. Other outcomes include the complaint being found to be outside of the remit of IPSO, not being pursued or being resolved through mediation.
Fake News Google Trends Data
Based on Google Trends data, which looks at the popularity of search terms, we can see the following “fake news” as a search query globally:

- The search term began to surge in popularity in November 2016, which can be equated to the Trump effect, as it became a tool to denigrate news that was not seen as complimentary to the Trump presidency.
- It peaked in 2018 and searches have been in decline globally since March 2019 but it remains a query (as of July 2019) that is over 3 times as popular as it was in October 2016.
If we look at the UK specifically, a similar pattern applies.

Within the UK, the query is particularly popular in:
- Portsmouth
- Oxford
- Cambridge
- Liverpool
- Cardiff

Search Volume at a City Level
We used kwfinder.com to pull data about the number of searches for “fake news” by city in the UK taking an average of the past 3 years to give a monthly search figure.
We then:
- Multiplied the figure by 12 to give an approximate annual figure
- Took population data for each city from the most recent Census
- Calculated the percentage of people making a search in each of those places based on an assumption that each search came from a different individual. While this may not be the case, using the same methodology for each city allows us to determine the town or city in which people are the likeliest to make a search for “Fake news.”
Our findings:
|
City/Town |
"Fake news" Searches/Month |
"Fake News" Searches Per Year |
Population |
% of People Making a Search (Assuming Searches Equally Divided) Each Year |
|
Oxford |
110 |
1320 |
159994 |
0.83% |
|
Cambridge |
70 |
840 |
145818 |
0.58% |
|
Bath |
40 |
480 |
94782 |
0.51% |
|
Manchester |
210 |
2520 |
510746 |
0.49% |
|
Belfast |
110 |
1320 |
280211 |
0.47% |
|
Exeter |
40 |
480 |
113507 |
0.42% |
|
Dundee |
50 |
600 |
147285 |
0.41% |
|
Newcastle upon Tyne |
90 |
1080 |
268064 |
0.40% |
|
Colchester |
40 |
480 |
119441 |
0.40% |
|
Slough |
50 |
600 |
155298 |
0.39% |
|
Edinburgh |
140 |
1680 |
459366 |
0.37% |
|
Brighton |
70 |
840 |
229700 |
0.37% |
|
Worcester |
30 |
360 |
100153 |
0.36% |
|
Lincoln |
30 |
360 |
100160 |
0.36% |
|
Leeds |
140 |
1680 |
474632 |
0.35% |
|
London |
2400 |
28800 |
8173941 |
0.35% |
|
Salford |
30 |
360 |
103886 |
0.35% |
|
Glasgow |
170 |
2040 |
590507 |
0.35% |
|
Rochdale |
30 |
360 |
107926 |
0.33% |
|
Cardiff |
90 |
1080 |
335145 |
0.32% |
|
Norwich |
50 |
600 |
186682 |
0.32% |
|
Bristol |
140 |
1680 |
535907 |
0.31% |
|
Bolton |
50 |
600 |
194189 |
0.31% |
|
Aberdeen |
50 |
600 |
195021 |
0.31% |
|
Leicester |
110 |
1320 |
443760 |
0.30% |
|
Peterborough |
40 |
480 |
161707 |
0.30% |
|
Huddersfield |
40 |
480 |
162949 |
0.29% |
|
Nottingham |
70 |
840 |
289301 |
0.29% |
|
Northampton |
50 |
600 |
215773 |
0.28% |
|
Coventry |
70 |
840 |
325949 |
0.26% |
|
Bournemouth |
40 |
480 |
187503 |
0.26% |
|
Plymouth |
50 |
600 |
234982 |
0.26% |
|
Sheffield |
110 |
1320 |
518090 |
0.25% |
|
Oldham |
20 |
240 |
96555 |
0.25% |
|
Liverpool |
110 |
1320 |
552267 |
0.24% |
|
Birmingham |
210 |
2520 |
1085810 |
0.23% |
|
Wigan |
20 |
240 |
103608 |
0.23% |
|
Crawley |
20 |
240 |
106943 |
0.22% |
|
Maidstone |
20 |
240 |
107627 |
0.22% |
|
Sutton Coldfield |
20 |
240 |
109015 |
0.22% |
|
Eastbourne |
20 |
240 |
109185 |
0.22% |
|
Reading |
40 |
480 |
218705 |
0.22% |
|
Warrington |
30 |
360 |
165456 |
0.22% |
|
Sunderland |
30 |
360 |
174286 |
0.21% |
|
Cheltenham |
20 |
240 |
116447 |
0.21% |
|
Portsmouth |
40 |
480 |
238137 |
0.20% |
|
Gateshead |
20 |
240 |
120046 |
0.20% |
|
Swindon |
30 |
360 |
182441 |
0.20% |
|
Solihull |
20 |
240 |
123187 |
0.19% |
|
Southampton |
40 |
480 |
253651 |
0.19% |
|
Derby |
40 |
480 |
255394 |
0.19% |
|
Wolverhampton |
40 |
480 |
265178 |
0.18% |
|
Sale |
20 |
240 |
134022 |
0.18% |
|
Telford |
20 |
240 |
142723 |
0.17% |
|
Birkenhead |
20 |
240 |
142968 |
0.17% |
|
Ipswich |
20 |
240 |
144957 |
0.17% |
|
Poole |
20 |
240 |
154718 |
0.16% |
|
Bradford |
40 |
480 |
349561 |
0.14% |
|
Southend-on-Sea |
20 |
240 |
175547 |
0.14% |
|
Stoke-on-Trent |
30 |
360 |
270726 |
0.13% |
|
Kingston upon Hull |
30 |
360 |
284321 |
0.13% |
|
St. Helens |
10 |
120 |
102885 |
0.12% |
|
Woking |
10 |
120 |
105367 |
0.11% |
|
Luton |
20 |
240 |
211228 |
0.11% |
|
Stockport |
10 |
120 |
105878 |
0.11% |
|
Basildon |
10 |
120 |
107123 |
0.11% |
|
Basingstoke |
10 |
120 |
107355 |
0.11% |
|
Worthing |
10 |
120 |
109120 |
0.11% |
|
Rotherham |
10 |
120 |
109691 |
0.11% |
|
Doncaster |
10 |
120 |
109805 |
0.11% |
|
Chelmsford |
10 |
120 |
110507 |
0.11% |
|
Blackburn |
10 |
120 |
117963 |
0.10% |
|
High Wycombe |
10 |
120 |
120256 |
0.10% |
|
Newport (Wales) |
10 |
120 |
128060 |
0.09% |
|
Watford |
10 |
120 |
131982 |
0.09% |
|
Gloucester |
10 |
120 |
136362 |
0.09% |
|
Blackpool |
10 |
120 |
147,663 |
0.08% |
|
Milton Keynes |
10 |
120 |
171750 |
0.07% |
|
Middlesbrough |
10 |
120 |
174700 |
0.07% |
|
Swansea |
10 |
120 |
179485 |
0.07% |
In conclusion, our findings imply that the cities where people are most likely to be making this search are (in order):
- Oxford
- Cambridge
- Bath
- Manchester
- Belfast
Facebook and Fake News Statistics
Facebook has repeatedly found itself under pressure to do more to eradicate fake news peddling on its platform. And indeed, Facebook is where millions of interactions on fake news stories take place every day.
It was found that in the final 3 months of the 2016 US Presidential Campaign, (August 2016 up to election day), fake news stories got more interaction on Facebook than mainstream media stories did. The same was found to happen with the Brexit campaign.
There have also been a lot of negative stories about Ukraine shared by Russian media and bots.
The research from Buzzfeed suggests the following:

Engagement with fake news is falling on Facebook and fake accounts are being tackled, albeit slowly.
- In Q1 of 2018, Facebook removed 837 million pieces of spam (Source)
- In Q1 2018, Facebook also removed 583 million fake accounts (source)
- In 2016, known fake news content was getting around 200 million engagements on Facebook each month (source)
- As of September 2018, this is down to around 70 million engagements each month (Source)
Should you be Concerned about Fake News?
Statistics do suggest a surge in interest in fake news from 2016, with a continued interest in the topic and still plenty of engagement on social platforms with known fake news content.
But with more awareness in society of the negative effects of fake news, this has led directly to social media channels taking direct action to limit the amount of fake news, on channels such as Facebook, Twitter and Instagram. This means we are starting to see engagement with fake news fall globally.
So, even though the majority of people in the UK still believe that they encounter fake news daily or weekly, the percentage of fake news is falling.
What can you do to ensure you do not share fake news?
We still have a way to go before it is eradicated, so we recommend always checking multiple sources before sharing a story on your blog, newsletter or website. You can also use a fact-checking resource such as Snopes, to ensure that you only publish information that is genuine.
If you have any questions about this, or about sharing your own news, please contact JournoLink.
Use JournoLink to get your stories in the press
Easy-to-use, easy-to-learn publicity software built for small businesses.
Use JournoLink to get your stories in the press
Easy-to-use, easy-to-learn publicity software built for small businesses.
We hope you enjoy reading our PR resources!
Want to see how JournoLink's PR software can create publicity for your business?